Differential Accessibility was quantified for the following comparisons:
| Comparison name | Annotation column | Group 1 | N1 | Group 2 | N2 | |
| 1 | TeffMem_U vs Th1prec_U [sampleGroup] | sampleGroup | TeffMem_U | 4 | Th1prec_U | 4 |
| 2 | TeffMem_U vs Th2prec_U [sampleGroup] | sampleGroup | TeffMem_U | 4 | Th2prec_U | 4 |
| 3 | TeffMem_U vs Th17prec_U [sampleGroup] | sampleGroup | TeffMem_U | 4 | Th17prec_U | 4 |
| 4 | TeffMem_U vs Tfh_U [sampleGroup] | sampleGroup | TeffMem_U | 4 | Tfh_U | 5 |
| 5 | TCD8_U vs TCD8naive_U [sampleGroup] | sampleGroup | TCD8_U | 4 | TCD8naive_U | 4 |
| 6 | Bnaive_U vs Bmem_U [sampleGroup] | sampleGroup | Bnaive_U | 4 | Bmem_U | 4 |
| 7 | TeffNaive_U vs TeffMem_U [sampleGroup] | sampleGroup | TeffNaive_U | 4 | TeffMem_U | 4 |
| 8 | TCD8naive_U vs TCD8EM_U [sampleGroup] | sampleGroup | TCD8naive_U | 4 | TCD8EM_U | 4 |
| 9 | TregNaive_U vs TregMem_U [sampleGroup] | sampleGroup | TregNaive_U | 4 | TregMem_U | 4 |
Tables containing differential accessibility results can be found below.
| .peaks.cons | t10k | promoters_gc_protein_coding | ERB_BP_distal | ERB_BP_dnase | ERB_BP_proximal | ERB_BP_tfbs | ERB_BP_tss | |
| TeffMem_U vs Th1prec_U [sampleGroup] | TSV | TSV | TSV | TSV | TSV | TSV | TSV | TSV |
| TeffMem_U vs Th2prec_U [sampleGroup] | TSV | TSV | TSV | TSV | TSV | TSV | TSV | TSV |
| TeffMem_U vs Th17prec_U [sampleGroup] | TSV | TSV | TSV | TSV | TSV | TSV | TSV | TSV |
| TeffMem_U vs Tfh_U [sampleGroup] | TSV | TSV | TSV | TSV | TSV | TSV | TSV | TSV |
| TCD8_U vs TCD8naive_U [sampleGroup] | TSV | TSV | TSV | TSV | TSV | TSV | TSV | TSV |
| Bnaive_U vs Bmem_U [sampleGroup] | TSV | TSV | TSV | TSV | TSV | TSV | TSV | TSV |
| TeffNaive_U vs TeffMem_U [sampleGroup] | TSV | TSV | TSV | TSV | TSV | TSV | TSV | TSV |
| TCD8naive_U vs TCD8EM_U [sampleGroup] | TSV | TSV | TSV | TSV | TSV | TSV | TSV | TSV |
| TregNaive_U vs TregMem_U [sampleGroup] | TSV | TSV | TSV | TSV | TSV | TSV | TSV | TSV |
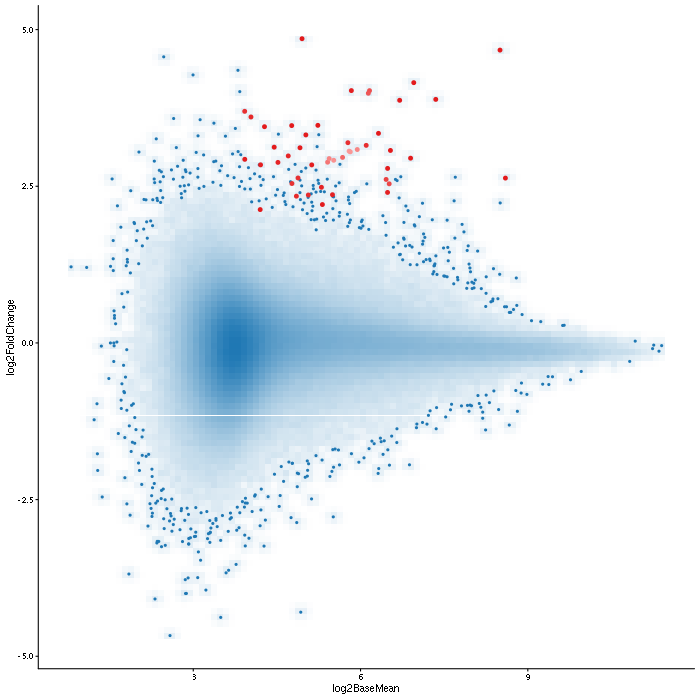
LOLA enrichment analysis
LOLA enrichment analysis [1] for differentially accessible regions.
| Comparison | |
| Region type | |
| Differential method |
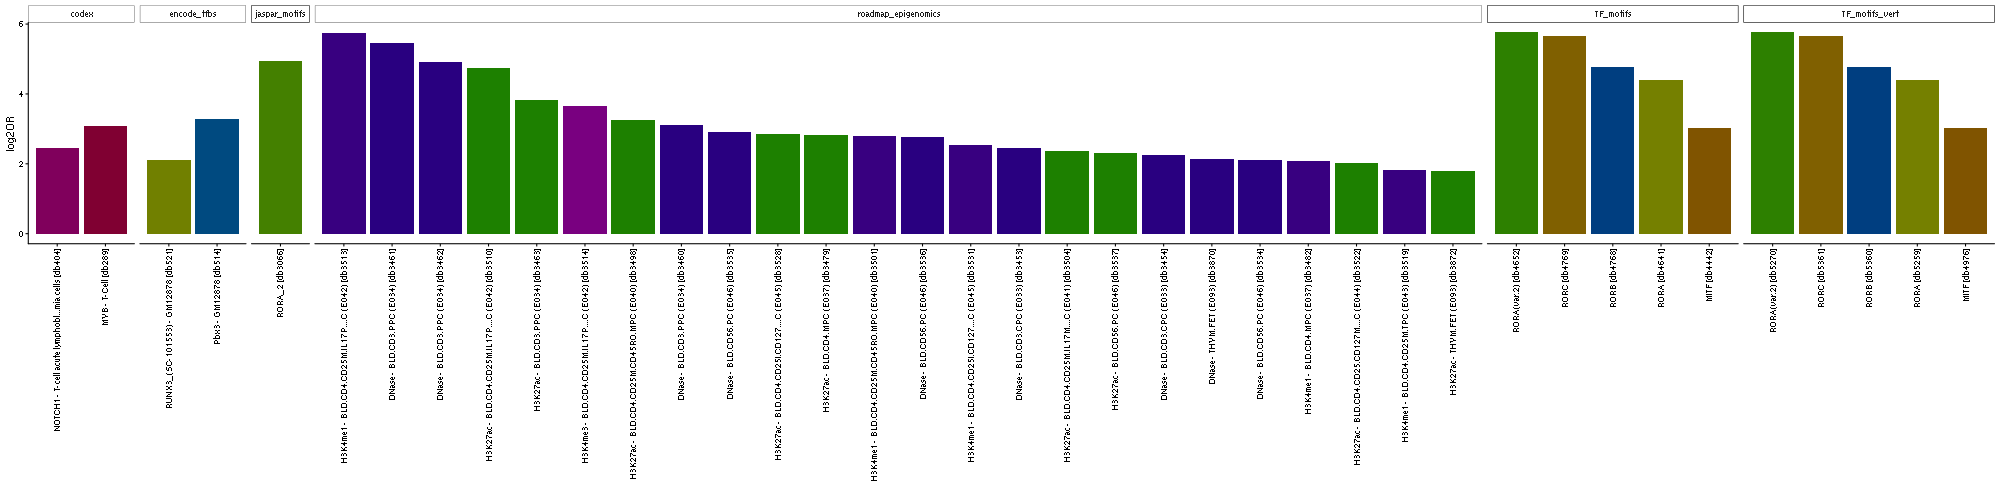
LOLA bar plot for enrichment of region annotations. Bar height denotes log2(odds-ratio). Bars are ordered according to the combined ranking in the LOLA result. Up to 200 most enriched categories (q-value < 0.01; Fisher's Exact Test) are shown for each comparison.