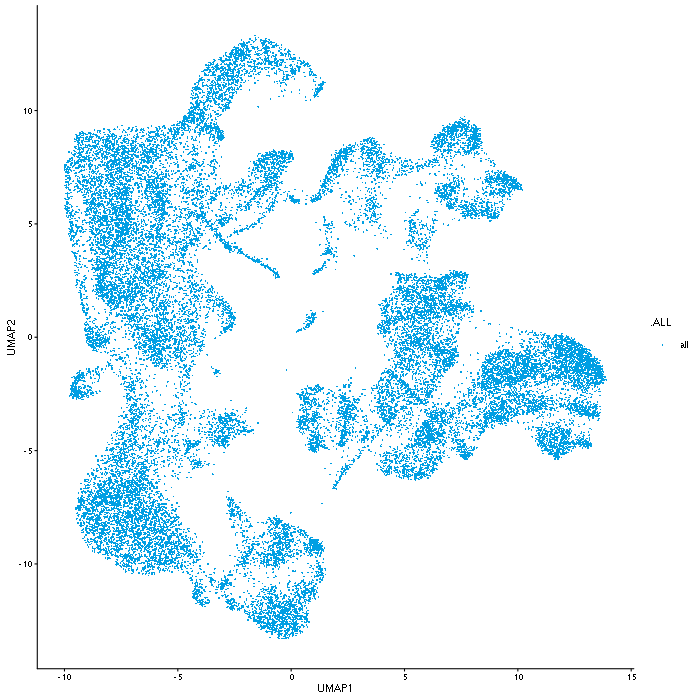
Iterative LSI was used for clustering and for dimension reduction.
This ATAC-seq dataset contains accessibility profiles for 31894 cells.
Signal has been summarized for the following region sets:
| #regions | transformations | |
| tiling5kb | 619150 | |
| tiling200bp | 15478482 | |
| promoter | 20345 | |
| .peaks.itlsi | 527696 |
Fragment data IS available.
Iterative LSI was used for clustering and for dimension reduction.
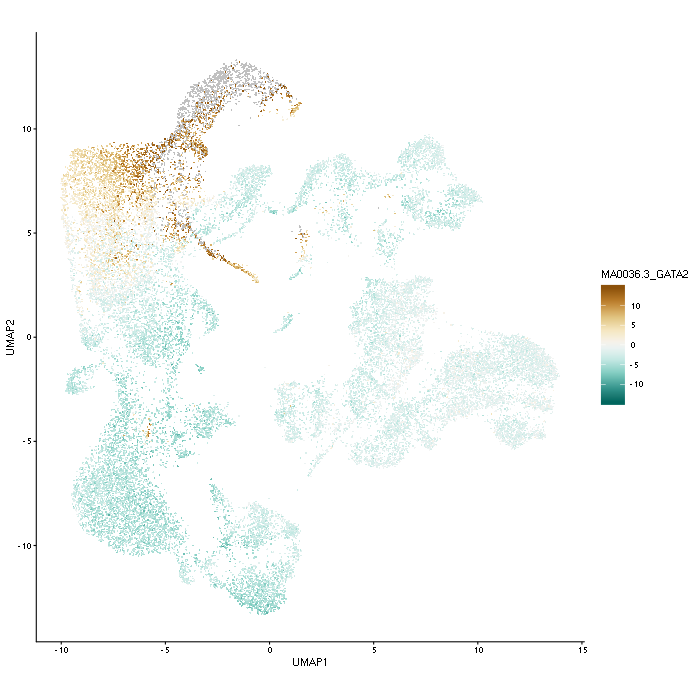
chromVAR [1] analysis. The following motif set(s) were used for the analysis: jaspar_vert. R data files of chromVAR deviation scores have been attached to this report:
| Region type |
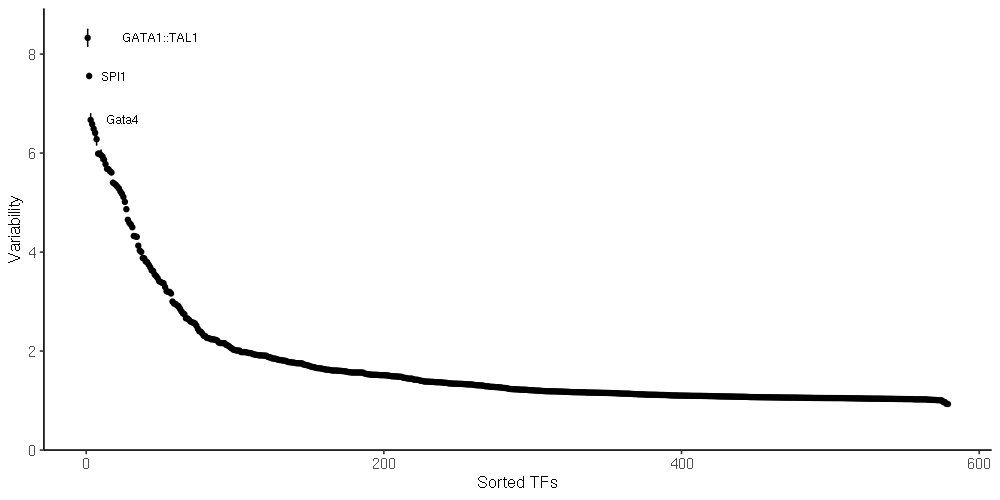
chromVAR variability. TF motifs are shown ordered according to their variability across the dataset.