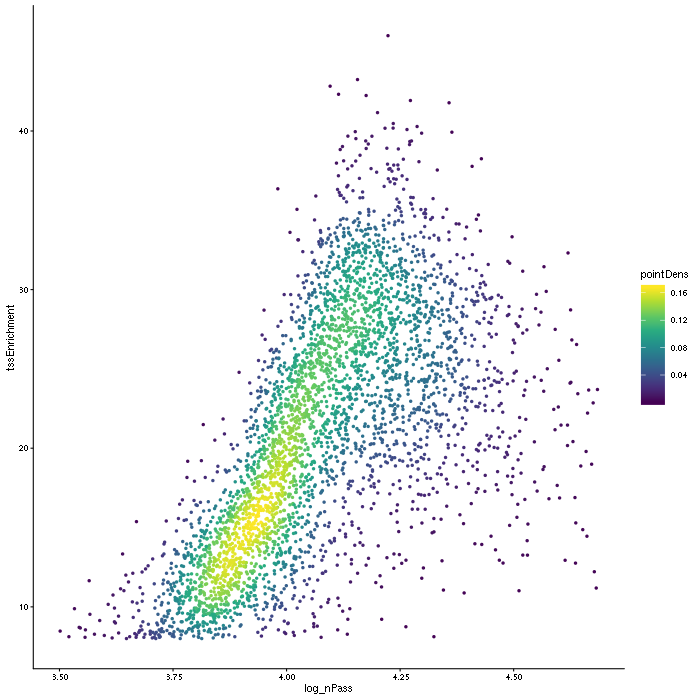
This section provides an overview on single-cell QC statistics.
| sample | nCells | median_fragment_nTotal | median_fragment_nPass | median_tssEnrichment |
| BMMC_D5T1 | 3847 | 11452 | 11452 | 20.9019607843137 |
| BMMC_D6T1 | 11793 | 11038 | 11038 | 19.1372549019608 |
| CD34_D7T1 | 2397 | 10152 | 10152 | 19.1782330909892 |
| CD34_D8T1 | 3202 | 19482 | 19482 | 26.5967020650932 |
| CD34_D9T1 | 3681 | 14190 | 14190 | 25.0687190764156 |
| PBMC_D10T1 | 2651 | 10588 | 10588 | 26.2842949079824 |
| PBMC_D11T1 | 932 | 5535 | 5535 | 9.98039215686275 |
| PBMC_D12T1 | 809 | 13453 | 13453 | 32.6214562258024 |
| PBMC_D12T2 | 1208 | 19002.5 | 19002.5 | 30.2578803673368 |
| PBMC_D12T3 | 1374 | 12553 | 12553 | 23.1006413014527 |

